Bitcoin Options Skew as a Regime Signal: What DVOL Tells You
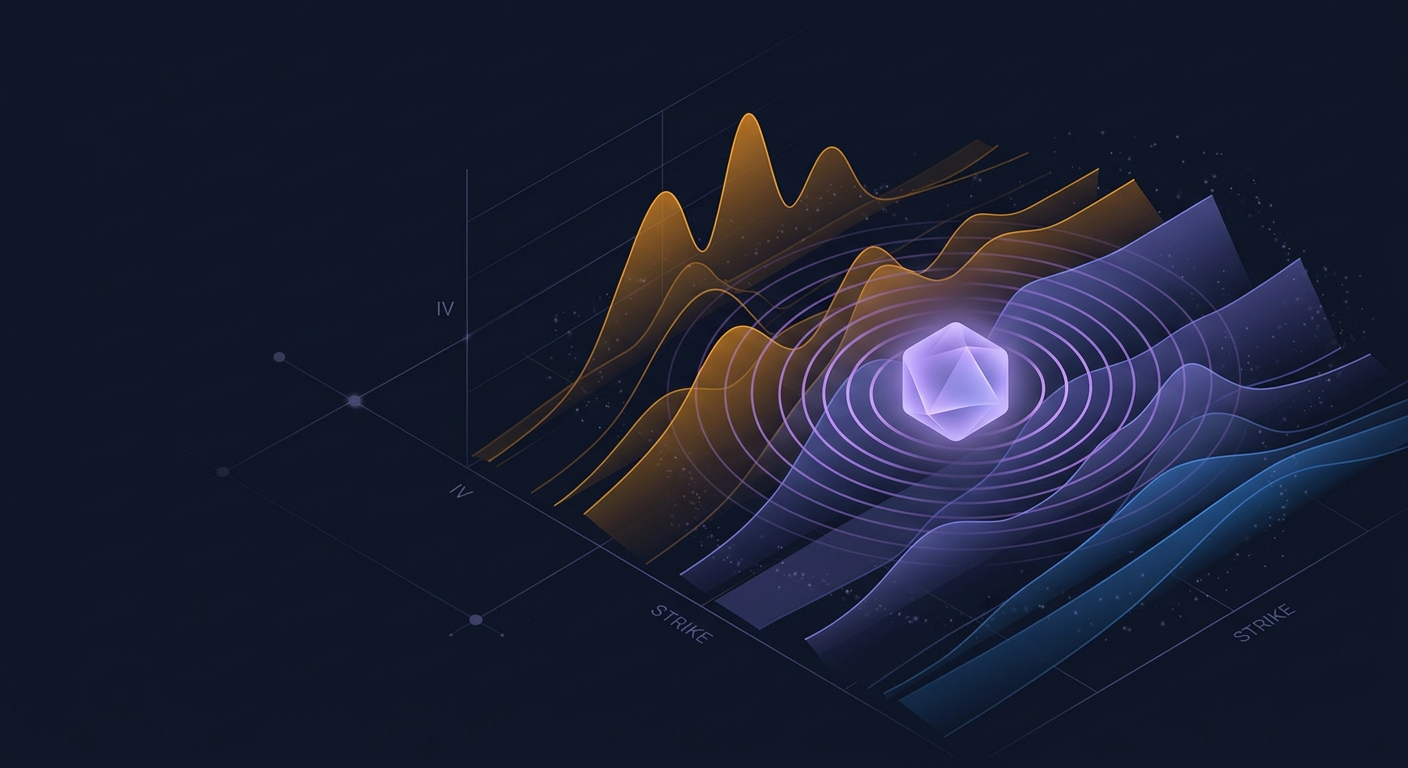
Most crypto traders watch price. A smaller group watches funding rates and open interest. Fewer still pay attention to bitcoin options skew — and that's precisely why it remains one of the more reliable leading indicators of regime change in crypto markets.
This post breaks down what skew is, how the Deribit Volatility Index (DVOL) fits into the picture, and why a shift in skew direction has historically preceded major regime transitions — including the 2023 bull market confirmation that caught many traders flat-footed.
What Is Put/Call Skew?
Options pricing is not symmetric. In any liquid options market, puts (the right to sell) and calls (the right to buy) at equivalent distances from the current price rarely trade at the same implied volatility. The difference between them is called skew.
When puts are more expensive than calls — meaning traders are paying a premium to hedge downside risk — skew is said to be negative (or bearish). When calls trade at a higher implied volatility than puts, skew is positive (or bullish), indicating that market participants are willing to pay up for upside exposure.
In crypto options markets, skew is typically quoted as the difference in implied volatility between out-of-the-money (OTM) calls and OTM puts at a fixed delta — most commonly the 25-delta options. A 25-delta risk reversal showing calls at 5 vol points above puts reads as +5 skew. The same structure showing puts 5 points above calls reads as -5.
This isn't just an abstract pricing quirk. Skew reflects the collective positioning and fear level of sophisticated market participants — hedge funds, market makers, and institutional desks who use options to manage real risk.
Why Negative Skew Signals a Risk-Off Regime
When bitcoin options skew turns sharply negative, it means the options market is pricing in a greater probability of a significant downside move than an equivalent upside move. Demand for puts is outstripping demand for calls.
This happens for several reasons:
- Holders of spot BTC buy puts as portfolio insurance
- Short-sellers buy puts to lock in gains or amplify downside bets
- Market makers demand higher premiums for puts because they're harder to hedge in a fast-falling market
For regime detection purposes, the critical signals are: 1. Skew turning sharply negative after a period of neutrality — early warning of a potential regime flip to bearish 2. Persistently negative skew during a drawdown — confirmation of a sustained risk-off regime 3. Skew bottoming and mean-reverting back toward zero — early evidence that the selling pressure is exhausting itself
Introducing Bitcoin DVOL
Skew tells you which direction the options market fears. Bitcoin DVOL — the Deribit Volatility Index for Bitcoin — tells you how much it fears anything at all.
Modelled after the CBOE VIX for equities, the Deribit Volatility Index measures the 30-day implied volatility of BTC options across the entire options surface, weighted and interpolated to produce a single forward-looking number. Where the VIX is often called the "fear gauge" for stocks, DVOL serves the same function for crypto options volatility.
A DVOL reading of 50 means the options market is pricing in annualised BTC moves of roughly 50% over the next 30 days. During calm trending markets, DVOL might compress to 40-45. During acute stress events — exchange collapses, regulatory shocks, macro deleveraging — it can spike to 90 or above.
The relationship between DVOL and skew is important:
- High DVOL + Negative Skew: Maximum fear. The market is pricing large moves AND those moves are expected to be to the downside. Classic bear regime signature.
- Low DVOL + Positive Skew: Complacency with a bullish tilt. Often seen in mature bull runs before a volatility expansion event.
- Rising DVOL + Skew flipping from negative to neutral: The transition zone. This is where regime shifts begin to show up in options data before they're confirmed by price action.
The 2023 Regime Shift: Skew as Confirmation
The 2023 Bitcoin bull run is a useful case study in how bitcoin options skew behaved around a major regime transition.
For most of 2022, skew was persistently negative. The collapse of Terra/LUNA in May, followed by Three Arrows Capital and then FTX in November, kept the options market in a sustained state of put-demand. DVOL spiked repeatedly. Calls were cheap relative to puts because nobody wanted to pay for upside in an environment of cascading counterparty failures.
Through Q4 2022 and into early 2023, something began to shift. Put premiums started declining relative to calls. Skew gradually moved from deeply negative toward neutral. DVOL, while still elevated, stopped making new highs even as spot BTC remained depressed.
Then, as BTC broke through the $25,000 level in early 2023 and sustained above it, skew flipped positive. Calls began trading at higher implied volatility than equivalent puts. This wasn't just a sentiment survey — it was real capital being deployed into upside options, a sign that sophisticated participants were positioning for further appreciation rather than hedging against collapse.
For traders who were watching the Deribit Volatility Index and 25-delta skew, the regime shift was visible in the options surface before price had confirmed a new bull trend by most traditional technical metrics. The options market, populated by better-capitalised and more analytically sophisticated participants than the spot market, was pricing in the new regime ahead of the crowd.
This is the core thesis: options markets process information faster than spot markets, and skew is one of the clearest ways that information is expressed.
Volatility Term Structure: The Third Dimension
Skew and DVOL are two dimensions of options analysis. The third is volatility term structure — how implied volatility varies across different expiry dates.
In normal conditions, crypto options exhibit contango: short-dated options (1-week, 1-month) trade at lower implied volatility than longer-dated options (3-month, 6-month). This makes intuitive sense — the further out you go, the more uncertainty there is.
During stress events, term structure inverts — short-dated options become more expensive than long-dated ones because traders are scrambling to hedge immediate risk. This inversion is called backwardation.
When you see all three signals align — negative skew, elevated DVOL, and inverted term structure — you have the options market's fullest expression of a risk-off regime. Conversely, normalising term structure (moving back to contango), declining DVOL, and skew turning positive together form a strong composite signal of regime recovery.
This is exactly the kind of multi-dimensional regime analysis that separates reactive traders from systematic ones. Understanding how market regimes are classified helps put these signals into a broader framework — options data doesn't exist in isolation, but as one layer in a stack of regime evidence.
Grounding This in Current Conditions
As of May 2026, BTC is trading around $77,458 — having pulled back from the $82,000 level reached when the Clarity Act advanced through Congress. That legislative milestone represented a meaningful reduction in regulatory uncertainty, which is exactly the kind of macro catalyst that historically shifts options market sentiment.
When positive regulatory news arrives, watch for skew to respond. If the market genuinely re-prices the risk environment — fewer systemic threats, clearer operating rules for exchanges and custodians — you'd expect put demand to ease and call demand to pick up. A sustained move in bitcoin options skew toward positive territory following the Clarity Act's progress would be consistent with a regime-level shift in institutional perception of crypto risk.
The current price level, while below the recent $82,000 high, doesn't negate the significance of the regulatory development. What matters for regime analysis is whether options market participants are treating this as a durable change or a temporary pop. Skew and DVOL will answer that question more honestly than price alone.
For traders trying to contextualise these signals systematically, platforms like RegimeRisk combine multiple data streams — including volatility-derived signals — to classify the current market regime in real time, removing the need to manually synthesise these inputs across different data sources.
For a deeper look at how on-chain data complements options signals in regime detection, see our post on on-chain metrics and regime detection.
Practical Application for Traders
Knowing the theory is one thing. Here's how to actually use bitcoin options skew in practice:
Monitor 25-delta risk reversals daily. Deribit publishes this data publicly. A sustained move below -5 in the 25-delta RR (puts 5 vol points above calls) is worth treating as a risk-off signal. A move above +3 to +5 historically correlates with bullish regime conditions.
Use DVOL as a volatility regime filter. When the Deribit Volatility Index is above 70-80, the market is in an elevated-uncertainty state regardless of direction. High DVOL environments favour different position sizing and strategy selection than low DVOL environments.
Watch for divergences between skew and price. If price is making new highs but skew is turning negative (put demand rising), that's a warning sign. If price is making new lows but skew is mean-reverting toward neutral, that's often an early signal of selling exhaustion.
Don't use skew in isolation. Cross-reference with funding rates, open interest, and on-chain flow data. Options skew is one signal in a regime detection framework — powerful, but not infallible.
For more on how multiple signals combine into regime classifications, the post on understanding bull and bear regimes in crypto provides useful context on what defines a regime shift beyond any single metric.
Key Takeaways
Bitcoin options skew — specifically the 25-delta put/call risk reversal — is one of the most information-dense signals available to crypto traders, reflecting the collective risk positioning of the market's most sophisticated participants. When skew is persistently negative, the options market is pricing a risk-off regime; when it flips positive and sustains there, it has historically been an early confirmation of bull regime conditions, as seen in the 2023 transition.
The Deribit Volatility Index (bitcoin DVOL) complements skew by measuring the absolute level of fear and uncertainty priced into the market, and combining DVOL with skew direction and volatility term structure gives a three-dimensional view of market regime that price action alone cannot provide.
The current macro environment — with BTC at $77,458 following a regulatory catalyst in the Clarity Act — makes this a particularly relevant moment to watch options market signals, since legislative shifts of this magnitude can produce durable changes in institutional risk appetite that show up in skew before they're fully reflected in price. Monitoring these signals systematically, rather than reactively, is what separates regime-aware trading from noise-chasing.
Share this post
Track Bitcoin's Current Regime
See whether BTC is in a Bull, Bear, Range or Transition regime right now.
View Live Dashboard →